A reasonable first step in the study of Central American Indians is to identify and locate people of Amerindian heritage. Most attempts at mapping the distribution of Indians in Central America have been produced by anthropologists and based primarily on language, including those by Brinton (1891), Thomas and Swanton (1911), Lehmann (1920), Jiménez Moreno (1937), Mason (1940), Johnson (1940 and 1948), and McQuown (1955). Normally, the maps show approximate group boundaries for the period of Spanish contact. Nuhn's full-color, 1975 map, constructed at the Institute of Geography at Hamburg, Davidson's 1982 map, and Suárez's 1983 map all portray, in a general way, modern distributions. The more detailed ethnogeographical maps at the country and group scale are too numerous to document here, but the sketch atlas of Guatemalan groups produced by the Summer Institute of Linguistics is one remarkable example.
What is an Indian? To meet our definition of "Indian-ness," a Central American population must fall under one of the following criteria: it identifies itself as Indian, it uses a language native to America, or it is listed as "Indian" in the national census. Thus, these means of identification are culturally - rather than racially - oriented.
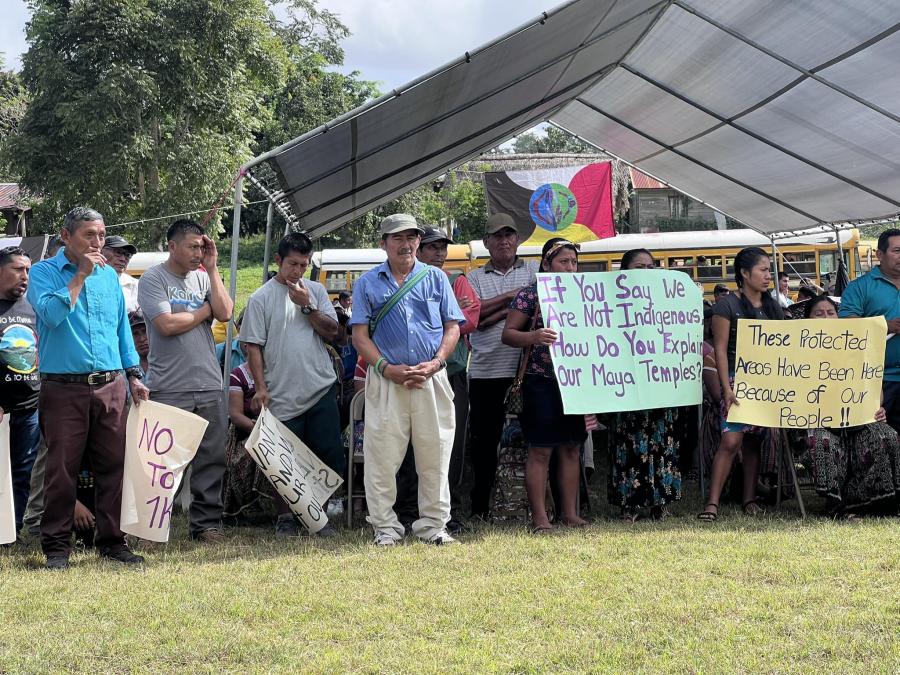
We prefer self-identification as an Indian marker - the first criterion - and know from our field work that we have a safe classification when we hear our hosts say "somos indígenas." Often these same people are weaving, baking clay pottery, dressing in traditional garb, and generally displaying other traits that indicate an Indian heritage. Obviously, it is impossible for a handful of researchers to so confirm in situ all Indian communities, but whenever possible visitations provide the most reliable data.
A second reasonably safe identification comes with the use of an Amerindian language. Because language is such an important ingredient in the preservation of Indian culture, its use, alteration, and loss is a critical issue. The language factor also allows us to include racially suspect groups, such as the Garífuna and Miskito of the Caribbean coast.
The final criterion - enumeration in the national census - is the most difficult to use. It would be nice if all Central American countries had a standard definition for "Indian" and had reliable and coordinated reporting, but that is not the case. In fact, censuses are becoming more irregular; some countries are even contemplating dropping ethnicity and language from the census questionnaire. Still, most of the Belizean, Guatemalan, Costa Rican, and Panamanian data presented on our map are confirmed at least partially by census information.
The cartography project presented here updates the previous maps and makes improvements in matters of scale and details of location by emphasizing four features:
1. Agglomerated, predominantly Indian settlements of more than 100 Indians (for Guatemala, only municipio capitals reported in the national census are mapped).
2. Agglomerated, predominantly non-Indian settlements, but with at least 100 Indians.
3. Areas of dispersed Indian settlement.
4. Major areas of acculturated Indians where the use of an Indian language is rare or absent.
We derived the statistics shown on the map, including population estimates for the early 1980s, from a review of recent literature, national censuses, field work, and several knowledgeable informants, including Peter Herlihy for Panama, María Bozzoli de Wille for Costa Rica, Jaime Incer B. for Nicaragua, and Fernando Cruz S. for Honduras.
Perhaps the most serious problems we encountered during the project, aside from acquiring verifiable identifications of Indians, were in standardizing dates and in accounting for massive Indian relocations. The population figures we offer here cover a range of about five years - for the early 1980s. During this period, Indian censuses were taken in Belize, Guatemala, Costa Rica, and Panama, and field work was conducted in Belize, Costa Rica, Honduras, and Nicaragua. Of course, during this period several areas were seriously affected by Indian migrations, especially in the western highlands of Guatemala and in Mosquitia. But even in peaceful Belize, Indian movements were significant for the time. For the most part, however, this map does not reflect Indian movements caused by civil turmoil early in this decade. For example, the small Honduran Sumu (or Sumo) community of about 300 on the middle Patuca River has during this decade been joined by approximately 3,000 of their Nicaraguan counterparts; our map, however, shows only the premigration Sumu distribution in Nicaragua.
To construct the map, we first placed information on 1:250,000 maps and reduced them to 1:2,000,000 for drafting; this map is on a scale of 1:5,000,000.
Article copyright Cultural Survival, Inc.


